Software
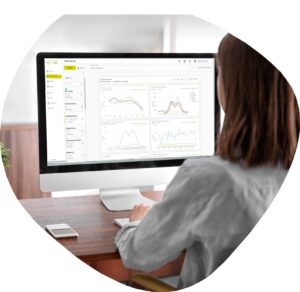
Our data analysis platform: Eco-Visio
When it comes to planning urban spaces or managing outdoor recreation, the data you collect needs to be made actionable.
Eco-Visio is an easy-to-use hub where you can view, manage, and analyse data in an instant, even if you aren’t a data expert.
How does it work?
All of our counting solutions are equipped to transmit data directly to your Eco-Visio account.
From there, Eco-Visio can be accessed on any computer, smartphone, or tablet with an internet connection. Once logged in, you can view data, analyse data, and create custom graphs and reports. Integrated tools also allow you to share raw data or reports with your partners. What makes Eco-Visio a powerful analytics platform? The number of key insights you can get in just a few clicks, including:
- Hourly, daily, and monthly profiles
- Volume comparisons between sites
- Heat maps
- Weekend vs. weekday averages
- Mode share analysis
- Weather effects analysis
Smart, relevant indicators
More than a simple data analysis tool, the Eco-Visio platform integrates 20+ years of business expertise we’ve gathered from our clients around the world.
That’s why our platform features relevant, targeted indicators that specifically help organisations in urban transformation and outdoor recreation. Change the way you view data with the help of an analytics platform that thinks the way you think.
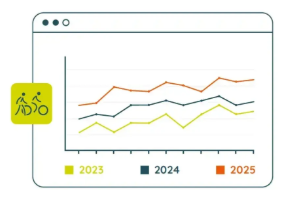
Long-term Trends
Comparing total count volumes by month or by year lets you see clear long-term trends.
This analysis is invaluable when determining the overall state of active transportation facilities and identifying a need for improvement.
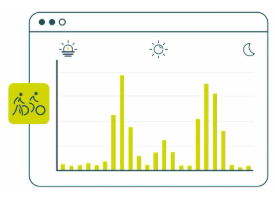
Profiles & seasonality
When looking at count volumes on a bike path or multi-use trail, the hourly profile reveals a lot about how people use the facility. For instance, a bike path with daily peaks at 9am and 5pm suggests that it is primarily used by people going to work.
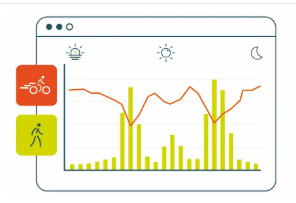
Speed and Traffic
Measure how fast bikes, e-bikes, and e-scooters go to inform your decisions on safety and conflicts of use. Should pedestrians be given their own sidewalk instead of a multi-use path? How much should a bike lane curve to reduce speeds and crashes? Should signs be put up to regulate how fast people go? Incorporating speeds is a way to analyse data at a higher level.
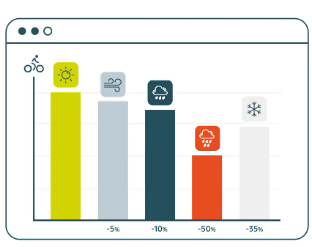
Weather analysis
Rain, wind, and cold temperatures are often perceived as major obstacles to cycling or walking. Using Eco-Visio’s weather analysis feature, you can concretely measure the impact of weather on count volumes and make the right planning decisions, without over- or underestimating the impact of the weather. Often times, favorable or unfavorable weather makes a difference, but the degree of change is usually a mystery.
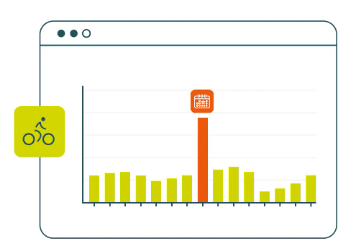
Events
Before and after studies are essential ways to track the success of your projects. Eco-Visio elevates this analysis by taking special events and public holidays into account, giving you a more accurate picture of the effects of your actions.
When you view data without factoring in events, you might be missing out on key information. For instance, an increase in counts may be linked to the new facility, but also to a public holiday or a special event like a marathon.
Visitor Flow
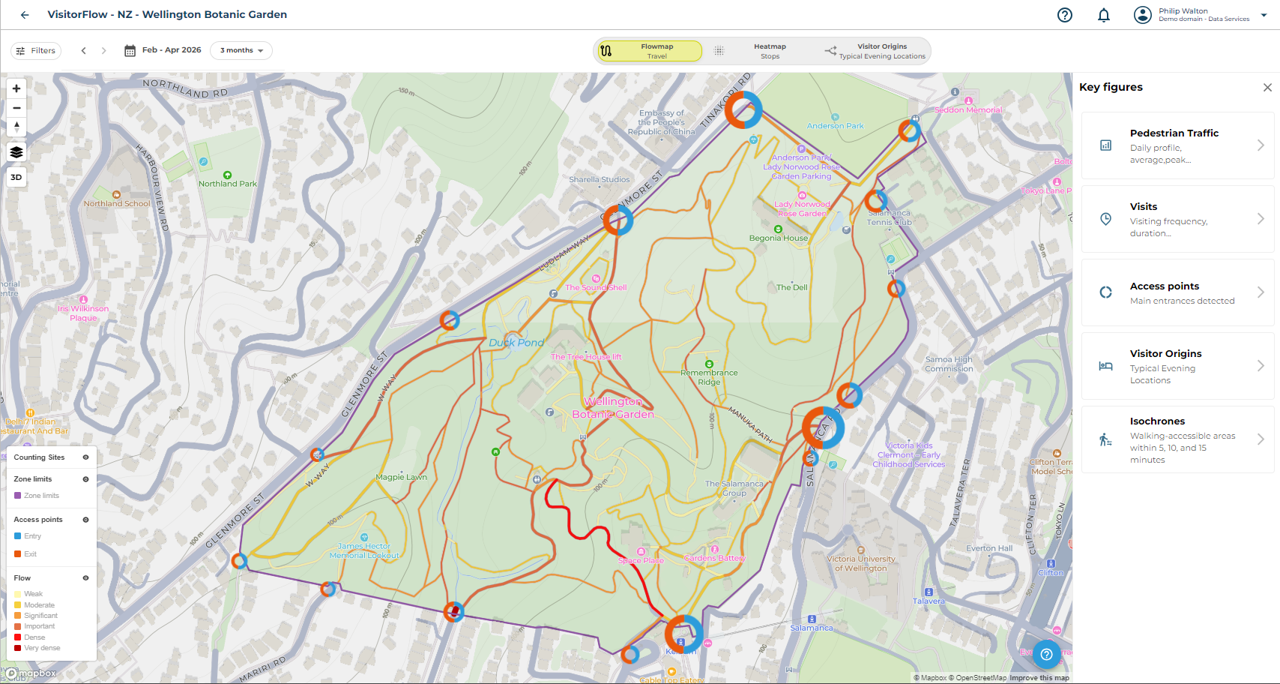
VisitorFlow is a data analysis solution that provides a comprehensive overview of your visitors. Using foot traffic counters and mobile phone data, this solution analyses pedestrian volumes, flows, profiles, and behaviours. Access objective quantitative and qualitative indicators to improve the visitor experience, increase walkability, advocate for funding, and more.
Integrating directly into Eco-Visio, it offers a unique combination of capabilities.
Connect your services with API Evo
+ Fine-tune Access to Your Data
+ Enable data export
+ Communicate with associations, partners, universities, etc.
+ Customize data integration (website, business application)
+ Timestamped data (if option available)
+ Data security and sovereignty at the heart of the solution
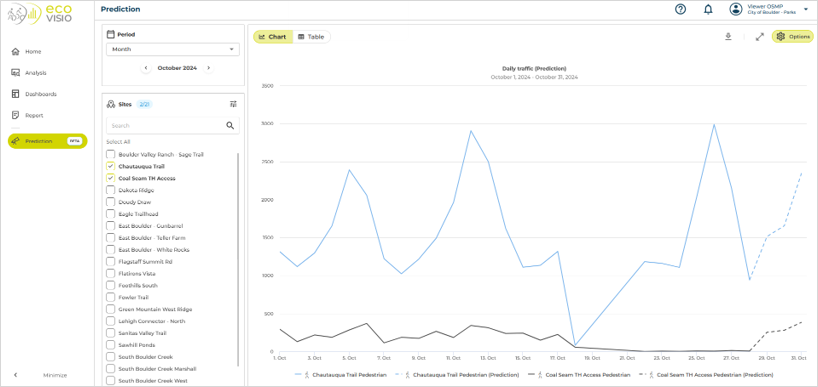
Predicting visitor numbers
Forecasting future visitor numbers based on historical data could be a game-changer for many organisations. For example, to anticipate a rush of tourists during a holiday to properly allocate your staff. This is a feature we will be integrating into the platform over the coming months.
Using AI to produce relevant analysis
In Eco-Visio, advanced functionalities use AI to highlight relevant insights (e.g.: a significant rise in counts on a Saturday, a strong weather impact on pedestrian traffic, etc.). A chatbot also lets you query the software in casual language to obtain the graph you need (e.g. “I’d like to see last month’s scooter traffic in both directions on Queen street”).

Communicate your data with ease: Public Webpage Evo
The Public Webpage Evo to promote the success of your projects
+ Create an interactive page of your sites
+ Share your data with OpenData
+ Publish your results on social networks or
your website
Data security and sovereignty at the heart of the solution
 Your data belongs to you
Protected and encrypted code
Secure access with authentification system